Performance
To measure the goodness of fit we use various evaluation metrics to check the classification model’s performance.
The performance is computed using the evaluation metric eval_metric in hgboost.hgboost.hgboost().
- Default
eval_metricare as following: ‘rmse’ : lightboost_reg
hgboost.hgboost.hgboost.lightboost_reg()‘rmse’ : catboost_reg
hgboost.hgboost.hgboost.catboost_reg()‘rmse’ : xgboost_reg
hgboost.hgboost.hgboost.xgboost_reg()‘auc’ : xgboost
hgboost.hgboost.hgboost.xgboost()(two-class)‘kappa’ : xgboost
hgboost.hgboost.hgboost.xgboost()(multi-class)‘auc’ : lightboost
hgboost.hgboost.hgboost.lightboost()‘auc’ : catboost
hgboost.hgboost.hgboost.catboost()
The performance of the model can deviate based on the threshold being used but the theshold this will not affect the learning process.
After learning a model, and predicting new samples with it, each sample will get a probability belowing to the class.
In case of our two-class approach the simple rule account: P(class of interest) = 1-P(class rest)
The threshold is used on the probabilities to devide samples into one of the classes.
AUC
The Area Under The Curve (AUC) and Receiver Operating Characteristics curve (ROC) are one of the most important evaluation metrics for checking any classification model’s performance.
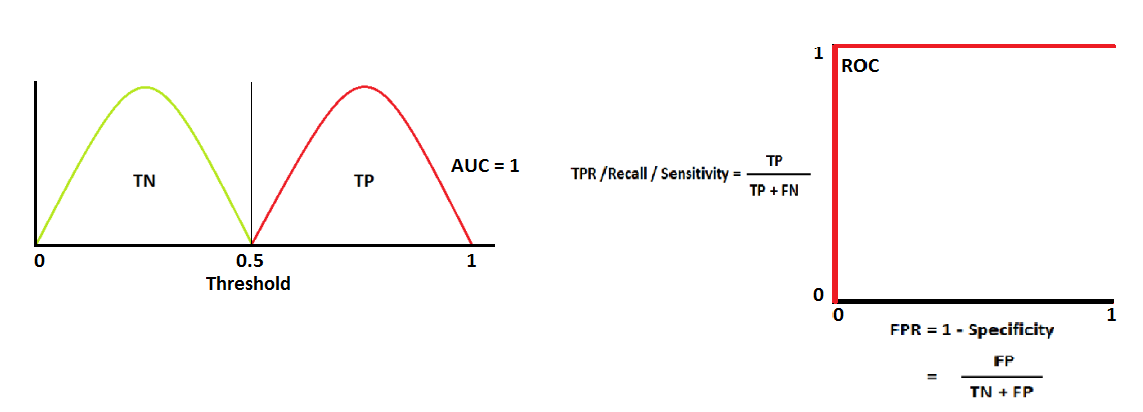
In our case we have a classification task, the probability ranges between [0-1], and the threshold for classification is set at 0.5 in case of two-class classification, where <=0.5 is class 1 and >0.5 is the other class.
This value can be tweaked to either reduce the number of False positives or True Negatives hgboost.hgboost.plot_validation().
The goal of the AUC-ROC is to determine the probability curve and degree or measure of separability by using various thresholds settings. It describes how much the model is capable of distinguishing between the classes. The higher the AUC, the better the model is at predicting whereas a AUC of 0.5 represents random results.
A perfect score would result in an AUC score=1 and ROC curve like this:
Confusion matrix
A confusion matrix is a table that is often used to describe the performance of a classification model (or “classifier”) on a set of test data for which the true values are known. It allows the visualization of the performance of an algorithm.
Kappa score
Cohen’s kappa coefficient is a statistic that is used to measure inter-rated reliability for qualitative (categorical) items.
scoring = make_scorer(cohen_kappa_score, greater_is_better=True)
Probability graph
The probability graph plots the probabilities of the samples being classified.
GPU support
All boosting methods seperately support GPU usage, however it is not always possible to enable GPU usage in its full extention because of the optimization that is performed in, among others, Hyperopt. Although GPUs can improve compution time, much larger gains in speed can often be achieved by a careful choice of algorithms.
GPU support for catboost is fully disabled because multiple evaluation sets are readily optimized and such approach is not GPU supported.
GPU support for xgboost is set as following:
tree_method='auto'and thepredictor='auto'. When ‘gpu_hist’ is used (instead of ‘auto’), it randomly runs out of memory and requires various other optimizations.
GPU usage can be enabled as following:
# Import library
from hgboost import hgboost

# Initialize
hgb = hgboost(gpu=True)

# Fit with any of the boosting methods
hgb.xgboost()
hgb.catboost()
hgb.lightboost()