Mask
The mask method is a local maximum filtering approach for detecting peaks in 2D data (images) using findpeaks.stats.mask(). This method is particularly effective for identifying prominent local maxima in spatial data.
Algorithm Overview: The mask method employs a multi-step process to identify peaks:
8-connected neighborhood analysis: Establishes connectivity patterns for each pixel
Local maximum filtering: Identifies pixels with maximal values in their neighborhood
Background removal: Eliminates background noise using a threshold-based approach
Peak isolation: Creates a final mask containing only the significant peaks
The method uses the input parameter limit to define the background threshold, where background = (X <= limit). The background is then eroded to separate peaks from the background. If the limit is set too low, artifacts may appear along the background border due to the local maximum filter’s characteristics.
The final mask, containing only the detected peaks, is derived by performing an XOR operation between the local maximum mask and the background.
Two-dimensional data
The mask method is specifically designed for 2D image data and provides excellent results for spatial peak detection using findpeaks.findpeaks.findpeaks.peaks2d(). Below is a comprehensive example:
# Import library
from findpeaks import findpeaks
# Initialize with mask method
fp = findpeaks(method='mask')
# Example 2d image
X = fp.import_example('2dpeaks')
# Fit mask method on the 2D data
results = fp.fit(X)
# The output contains multiple variables
print(results.keys())
# dict_keys(['Xraw', 'Xproc', 'Xdetect'])
The output is a dictionary containing multiple variables that can be used for follow-up analysis.
Details about the input/output parameters can be found here: findpeaks.stats.mask()
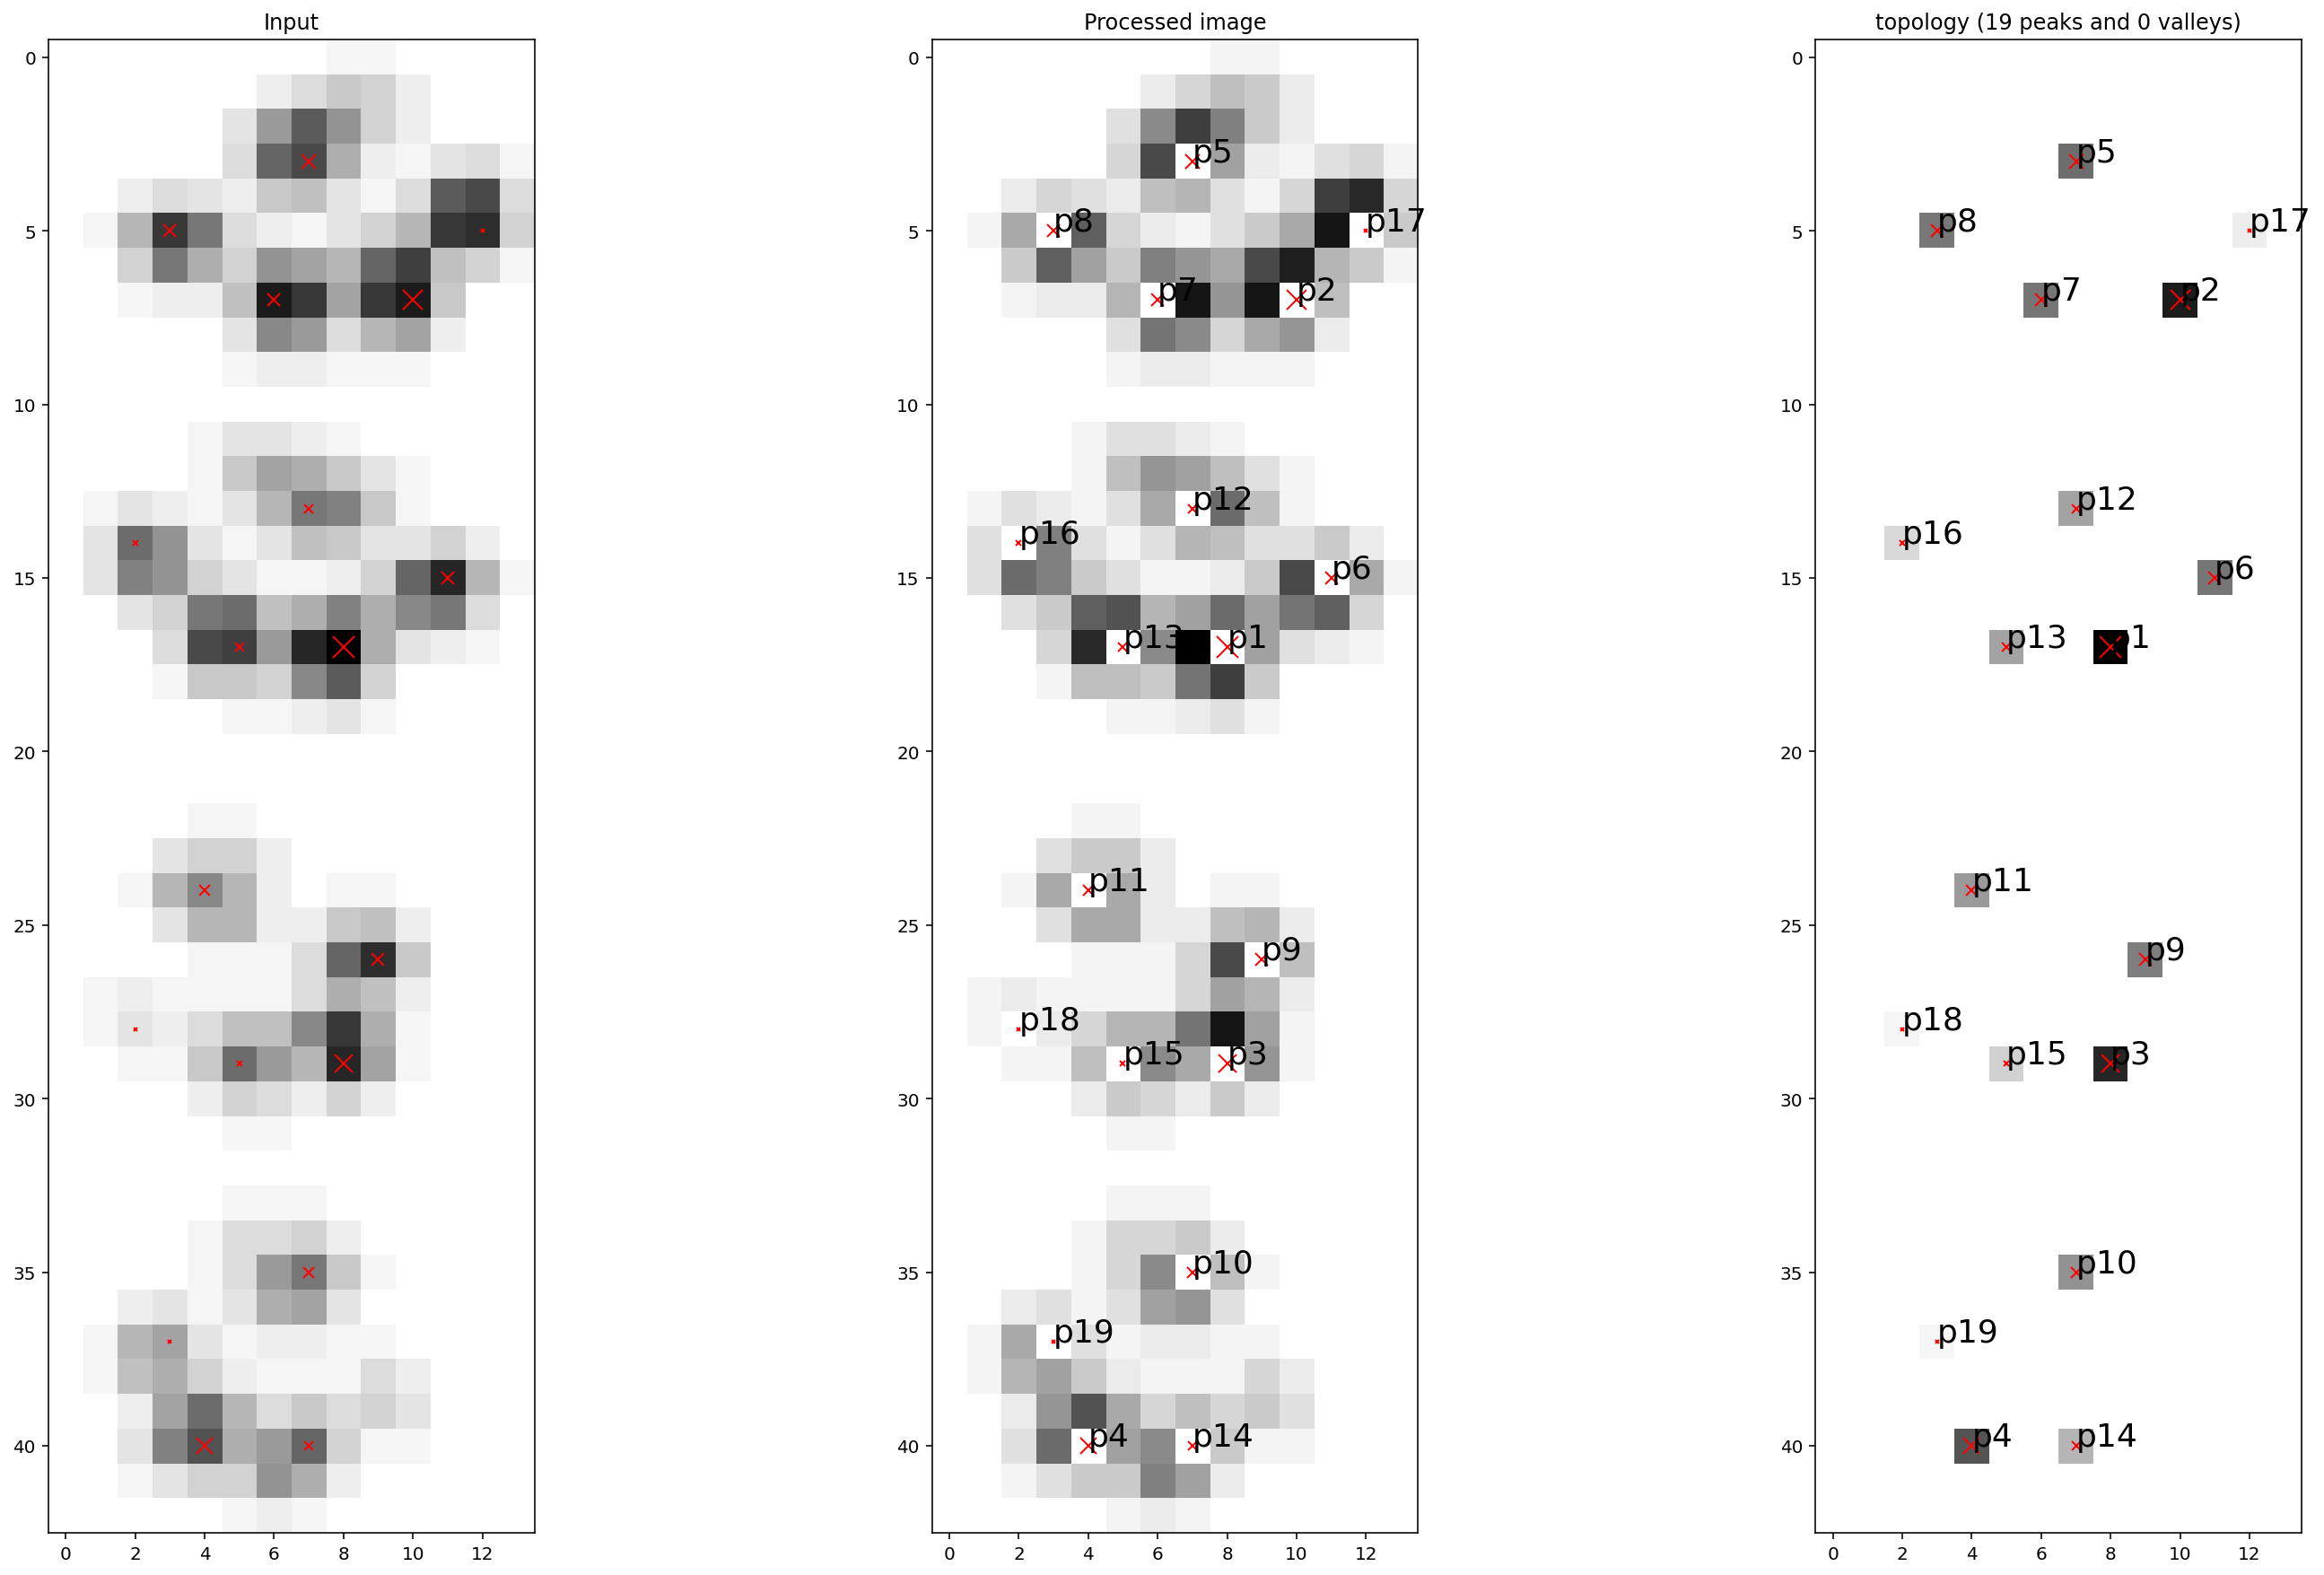
The output variables Xdetect and Xranked have the same shape as the input data. Elements with values > 0 indicate regions of interest (detected peaks).
Plot the image with the detected peaks using findpeaks.findpeaks.findpeaks.plot():
# Plot results with horizontal layout
fp.plot(figure_order='horizontal')