Caerus
Caerus is a python package [1] that determines the local-minima with the corresponding local-maxima independent of the timeframe, scale or trend.
The method is directly incorporated in findpeaks and has a strong advantage to find the local maxima and minima in stock-market data.
The detection of peaks and valleys in stockmarket data can be challanging because of its unpredictable behavior. The typical solution is to optimize parameters in specific peakdetection methods but such techniques can require a very specific set of input parameters and usually only work for certain timeframes, scales, or trends (bull/bear/sideways) in the market.
To overcome these challanges, I developed the method Caerus.
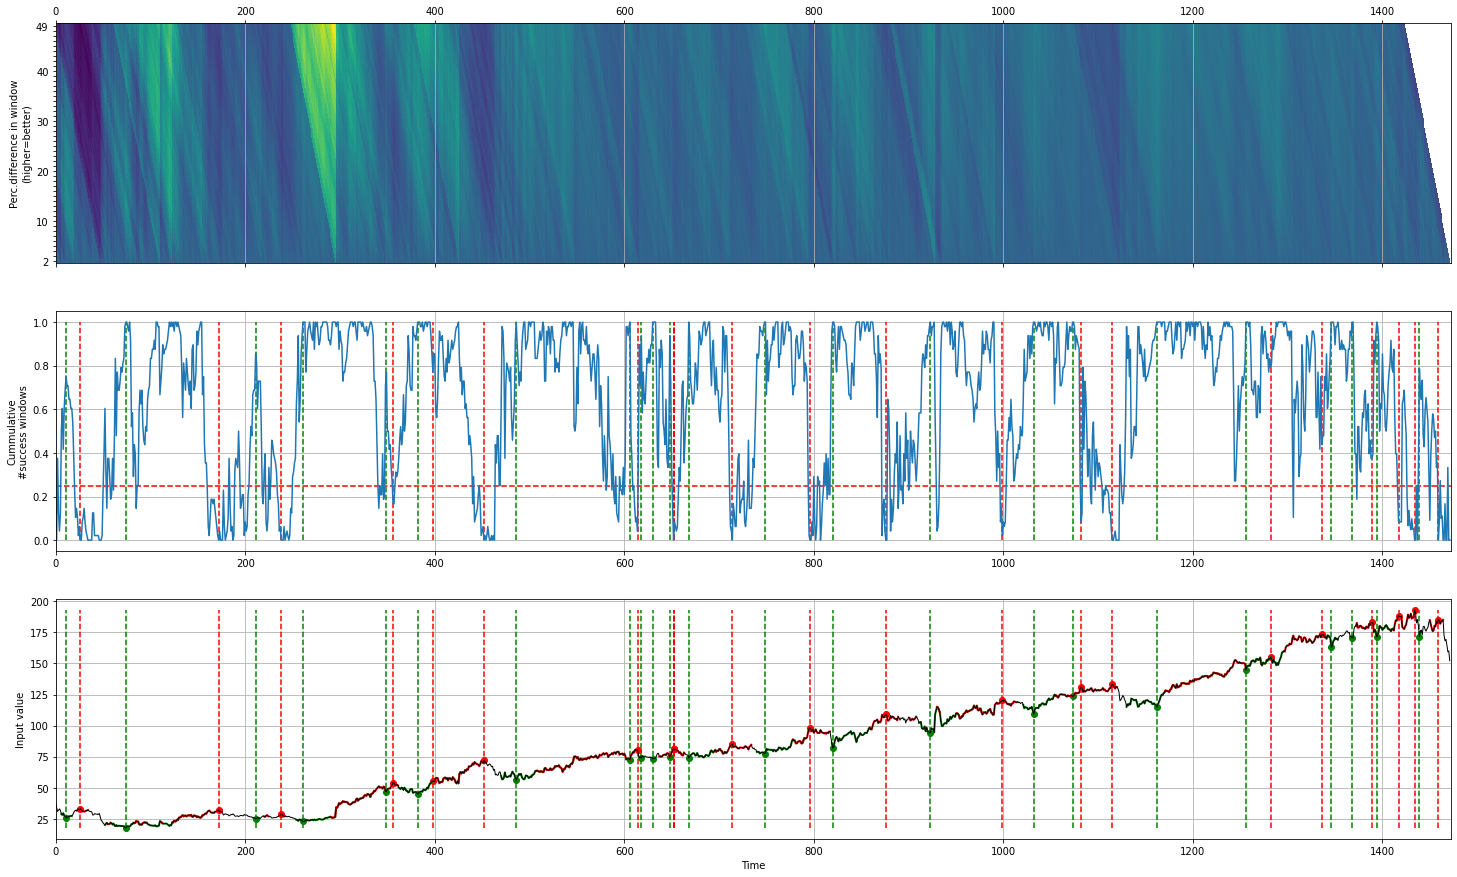
The method is build using a forward rolling window to iteratively evaluate thousands of windows. For each window a score of percentages is computed from the start-to-stop position. The resulting matrix is a [window x length dataframe] for which only the high scoring percentages, e.g. those above a certain value (minperc) are used.
The best scoring percentages is then aggregated by sum per time-point followed by a cut using the threshold. The resulting regions are subsequently detected, and represent the starting-locations of the trade. The stop-locations are determined based on the distance and percentage of te start-locations.
This method works only for one-dimensional data.
Stock market data
For the Caerus method, the minimum percentage (minperc) parameter can be set to declare a starting position with window relevant. The window size is used to determine whether there is an increase in percentage. start location + window. The use of smaller window sizes (eg 50) are able to pickup better local-minima, whereas Larger window sizes (eg 1000) will more stress on global minma. The default value for minperc is set to 5 and window size is set to 50.
# Import library
from findpeaks import findpeaks
# Initialize findpeaks with cearus method.
# The default setting is that it only return peaks-vallyes with at least 5% difference. Change this using params
fp = findpeaks(method='caerus', params={'minperc':5, 'window':50})
# Import example data
X = fp.import_example('facebook')
# Fit
results = fp.fit(X)
# Make the plot
fp.plot()
|
Lets print out some of the detected results:
# Results
print(fp.results['df'])

# index    labx   peak  valley      y     x
# 0        0  False   False   38.2318     0
# 1        0  False   False   34.0300     1
# 2        0  False   False   31.0000     2
# 3        0  False   False   32.0000     3
# 4        0  False   False   33.0300     4
#    ...    ...     ...       ...   ...
# 1467     0  False   False  169.3900  1467
# 1468     0  False   False  164.8900  1468
# 1469     0  False   False  159.3900  1469
# 1470     0  False   False  160.0600  1470
# 1471     0  False   False  152.1900  1471

# Number of peaks
print(fp.results['df']['peak'].sum())
# 20
# Number of valleys
print(fp.results['df']['valley'].sum())
# 23
The output is a dictionary containing a single dataframe (df) that can be of use for follow-up analysis.