D3 Motivation
D3 is a collection of modules that are designed to work together; you can use the modules independently, or you can use them together as part of the default build. The D3 website provides 168 working charts that allow for performant incremental updates during interaction and supports popular interaction such as dragging, brushing, and zooming. The charts can be used for many purposes, such as quantitative analysis, visualizing hierarchies, creating networks graphs, but also bar plots, line plots, scatter plots, radial plots, geographic projections, and various other interactive visualizations for explorable explanations. Some cherry-picked charts are shown in Figure 1.
Four parts
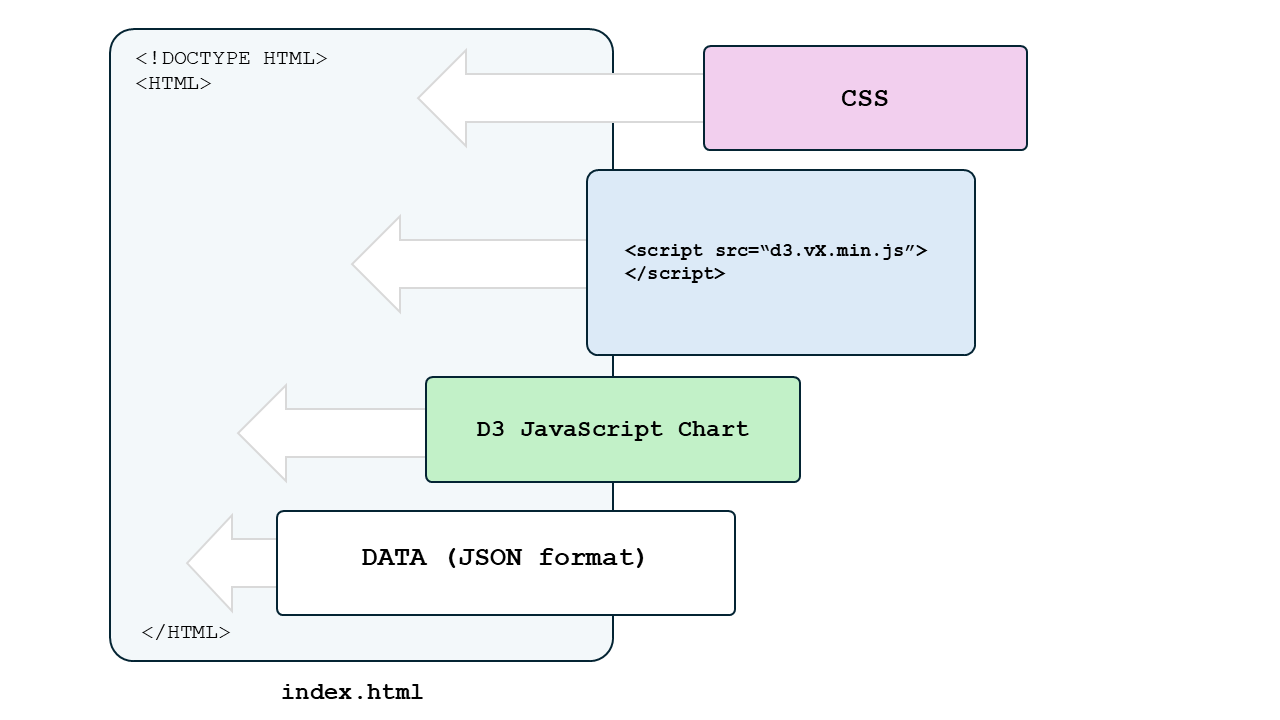
The d3graph library is created based on four distinct parts for which each part has its own role in the chart. To pythonize D3, all four parts are connected in an HTML file.
The Cascading Style Sheets (CSS).
The D3 module contains all required libraries.
Javascript to build the chart.
The Data as JSON file.
The schematic overview of our approach is as following:
The Cascading Style Sheets (CSS)
The CSS file is a simple mechanism for adding style in a structured manner to HTML files. For example, CSS files can define the size, color, font, line spacing, indentation, borders, and location of HTML elements. We are going to create force-directed network graphs, for which we will define the overall font sizes, font family, style, colors but also properties specific for the nodes, and edges. You can change the CSS accordingly, and set the properties as you think is best.
D3 module
The D3 module is the easiest part because it is directly embedded in the final HTML file. The D3 module contains all functions to create any of the charts. No edits in this file are required. The newest version is v7 which can be imported from a local source or the website. However, d3graph works with a slightly older version (v3) because many functions were readily created using this version.
Javascript for the network
The network is build using javascript, and was started with the basic functionality from the D3 website and many functionalities are added to build an interactive force-directed network graph. A slider is included that can break the edges of the network based on the edge value, a double click on a node will highlight the node and its connected edges and many more options to customize the network based on the edge and node properties. The output is a single HTML file that contains the interactive force-directed graph.
Data
It is important to get the data in the right shape for the javascript file. In d3graph, the input can be an adjacency matrix for which the columns and indexes are the nodes and the elements with a value of one or larger are considered to be an edge. With d3graph I solved the issue that a local .json-file using d3.json(), will not work because importing a local csv or json file with D3 is not considered to be safe. Therefore, all data is directly embedded in the final HTML file. However, depending on the amount of data, it can result in a massive HTML file. Nevertheless, embedding the data directly in the HTML will integrate all scripts and data into a single file which can be very practical.