Update repos to disk
In the following example we download initialize with the username and download the counts from Pypi for the repos.
# Import library
from pypiplot import Pypiplot

# Download all data for github user.
pp = Pypiplot(username='erdogant')

# Update all repos
pp.update()

# Update specific repos
pp.update(repo=['bnlearn','hnet'])
Download Statistics
Download the statistics from pypi and store on disk.
# Import library
from pypiplot import Pypiplot

# Download all data for github user.
pp = Pypiplot(username='erdogant')

# Get total stats across all repos
results = pp.stats()
# [pypiplot] >Retrieve files from disk..
# [pypiplot] >Computing heatmap across the last 360 days.

# Get some stats
results = pp.stats(repo=['distfit','pca','bnlearn'])

print(results.keys())
# ['data', 'heatmap', 'n_libraries', 'repos']

# Print data
print(results['data'])

#             bnlearn  distfit    pca
# date
# 2020-05-01    100.0       18.0  281.0
# 2020-05-02      6.0        4.0  260.0
# 2020-05-03     50.0       16.0  126.0
# 2020-05-04     82.0       64.0   86.0
# 2020-05-05     64.0      157.0   50.0
#             ...        ...    ...
# 2020-09-11    148.0      213.0   78.0
# 2020-09-12     96.0      102.0  144.0
# 2020-09-13     12.0       42.0  197.0
# 2020-09-14    156.0       92.0  244.0
# 2020-09-15     40.0       76.0  225.0
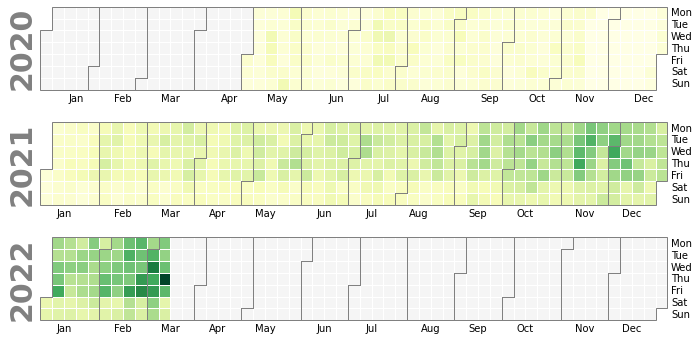
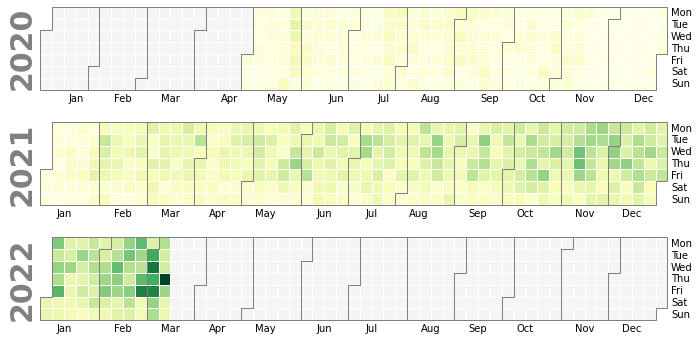
Calender plot
Make calender plot with counts.
# Get stats for all repos
pp.stats()

# Plot calender
pp.plot_cal()
|
Interactive Heatmap
Make heatmap with counts for the last year.
# Get stats for all repos
pp.stats()

# Plot calender
pp.plot_year()
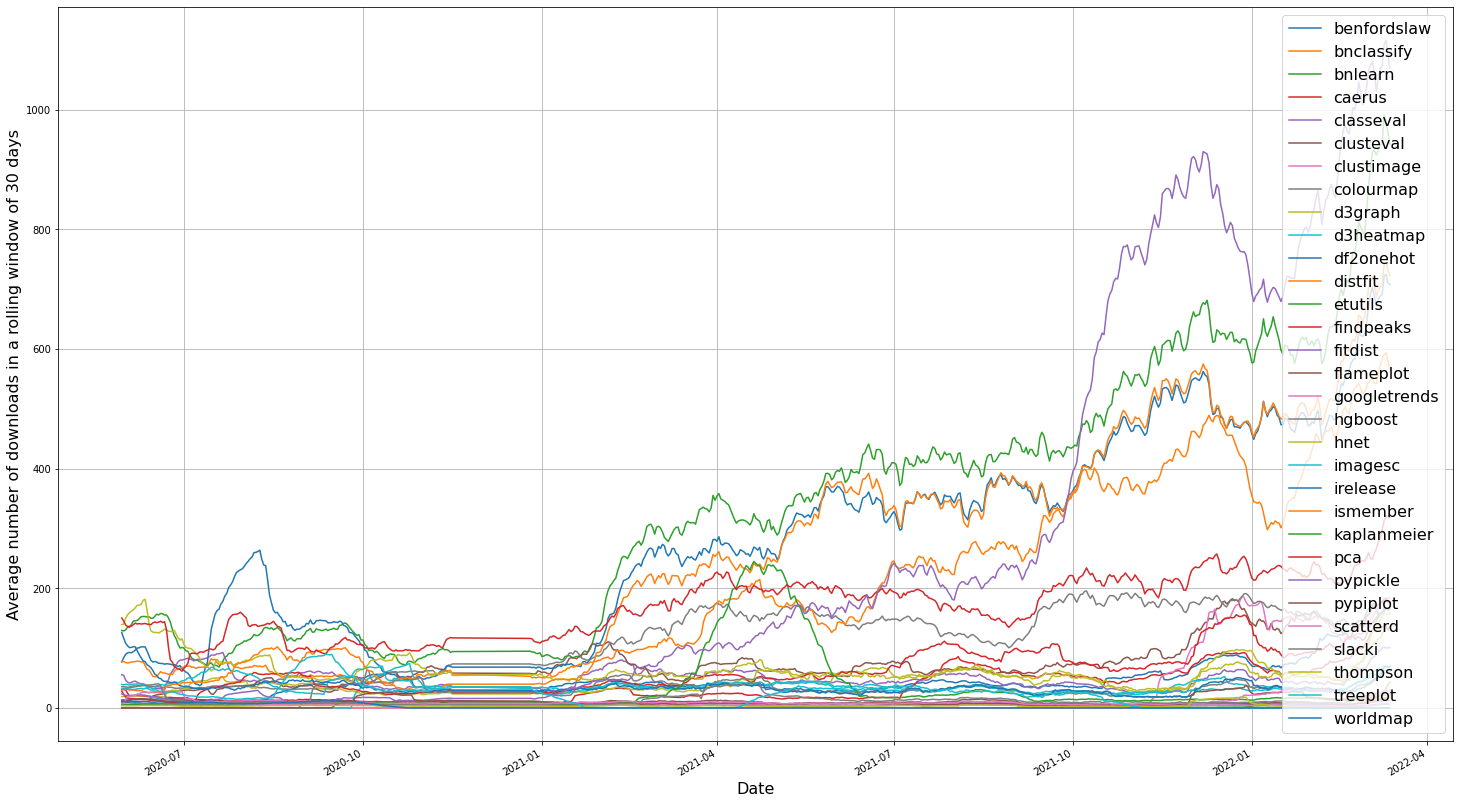
Line plot
Make lineplot with counts.
# Get stats for all repos
pp.stats()

# Make line plot
pp.plot()
|
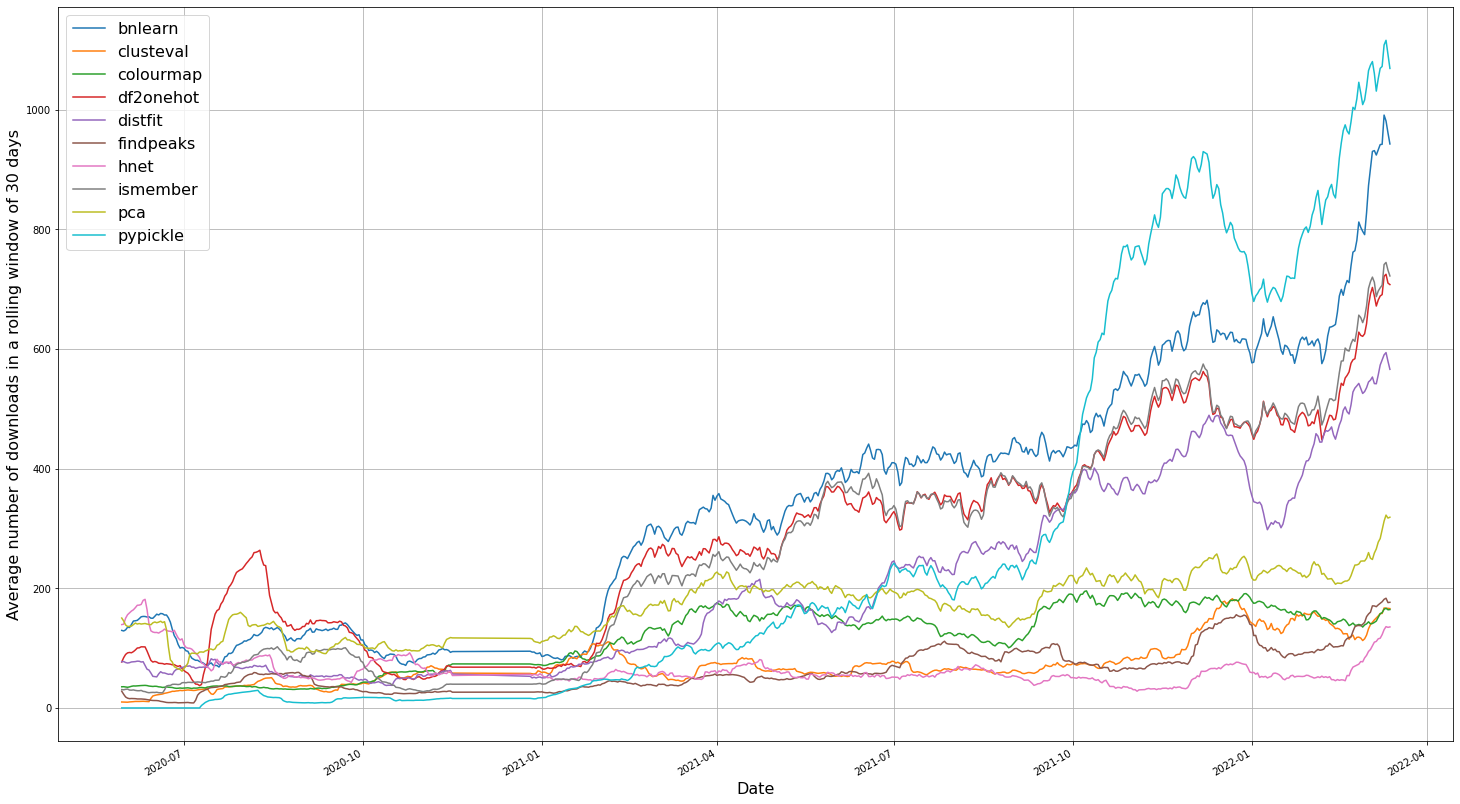
Top 10 performing repos
Gather the top 10 top performing repos.
# Initialize with username
pp = Pypiplot(username='erdogant')

# Get download statistics
pp.stats()

# Get top 10
repo=pp.results['data'].sum().sort_values()[-10:].index.values

# Get stats for the top10
pp.stats(repo=repo)

# Plot
pp.plot()
|
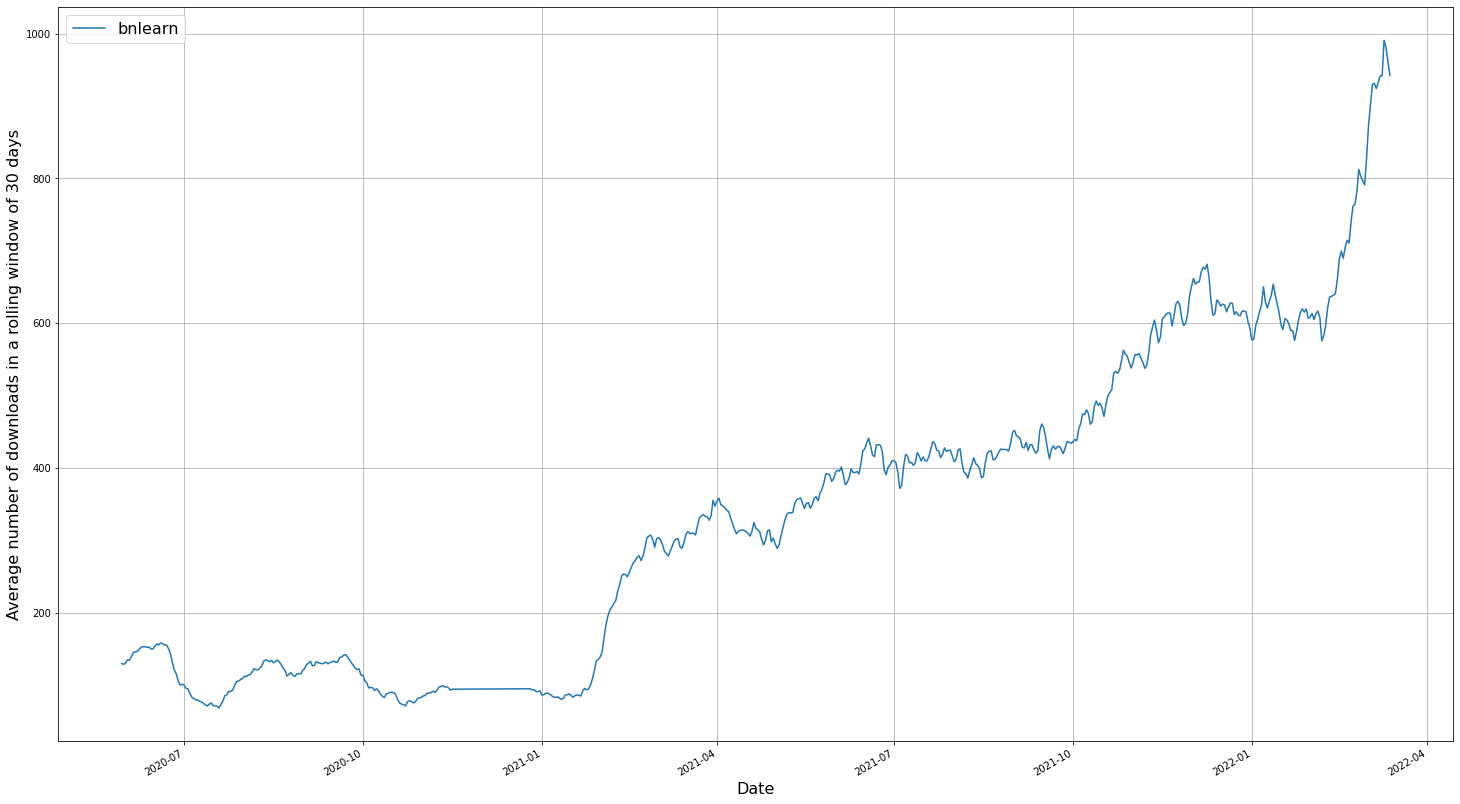
Analyze Specific repo
Here U will demonstrate how to gather stats and make plot for a specific repo.
# Initialize with username
pp = Pypiplot(username='erdogant')

# Get download statistics
results = pp.stats(repo='bnlearn')

# Plot
pp.plot()
pp.plot_cal()
pp.plot_year()
|
|
Interactive plot with all repos
Here U will demonstrate how to gather stats for all repos.
# Initialize with username
pp = Pypiplot(username='erdogant')

# Get total stats across all repos
results = pp.stats()

# Make plot
pp.plot_heatmap(vmin=10, vmax=2000, cmap='interpolateOranges', title='Total downloads across all repos')
Run pypiplot from terminal
* "-u", "--username" : username github
* "-l", "--library"  : library name(s)
* "-p", "--path"     : path name to store plot.
* "-v", "--vmin"     : minimun value of the figure.


python pypiplot/pypiplot.py -u 'erdogant' -p 'C://pypi_heatmap.html' -v '700'