Let’s check the the number of votes on different digits and determine whether it significantly deviates from benfords distribution. Benford’s Law has known distributions for the the first three digits. For other digits there is no distribution explicitly defined in classical Benford’s Law. However, we can assume a uniform distribution which is being done for every digit above 3 and for the last digits.
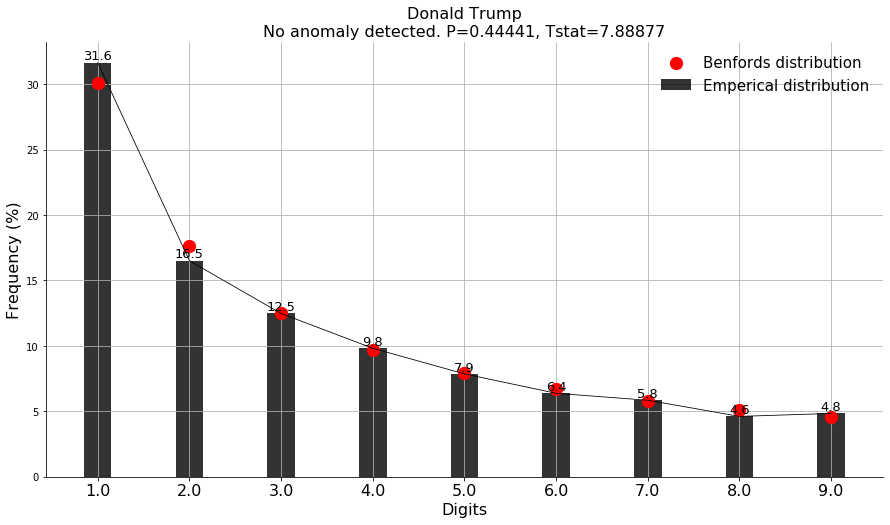
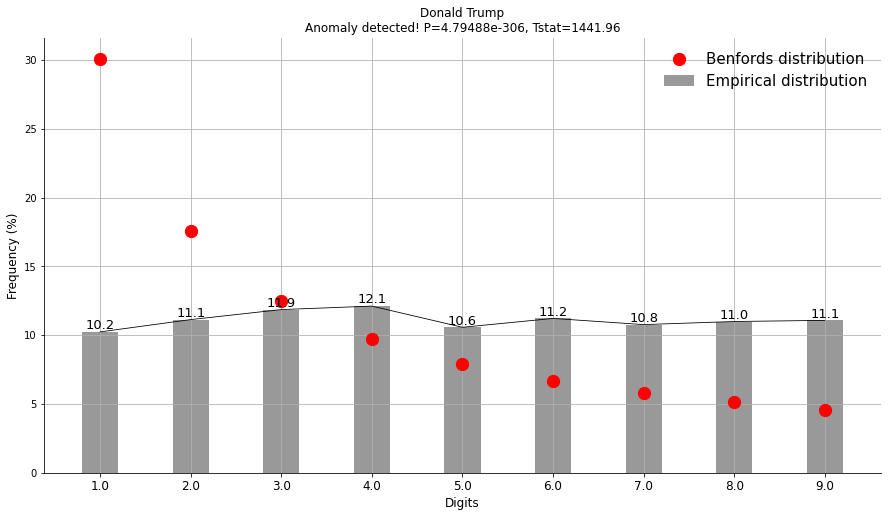
First digit test
In the following example we load the 2016 elections data of the USA for various candidates. We will check whether the votes are fraudulent based on benfords distribution.
from benfordslaw import benfordslaw

# Initialize
bl = benfordslaw(pos=1, alpha=0.05)

# Load elections example
df = bl.import_example(data='elections_usa')

# Extract election information.
X = df['votes'].loc[df['candidate']=='Donald Trump'].values

# Print
print(X)
# array([ 5387, 23618,  1710, ...,    16,    21,     0], dtype=int64)

# Make fit
results = bl.fit(X)

# Plot
bl.plot(title='Donald Trump')
|
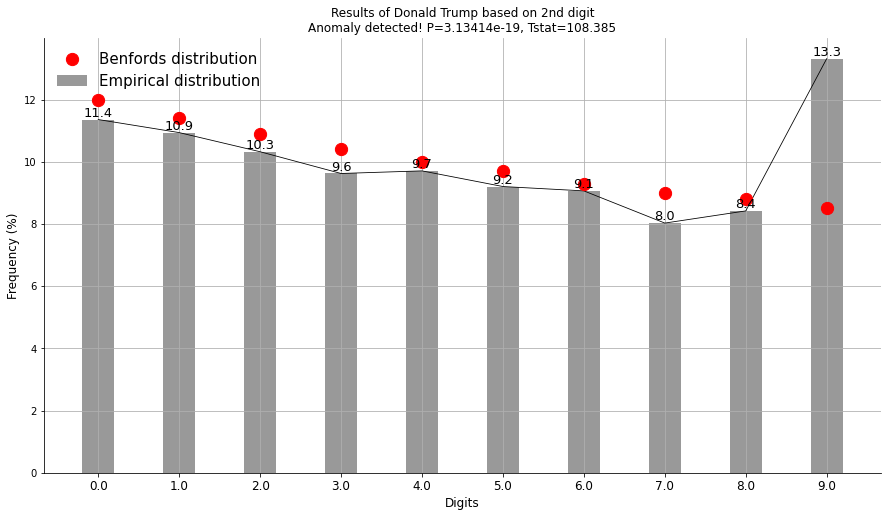
Second digit test
Let’s check the the votes on the second digit and determine whether it significantly deviates from benfords distribution.
from benfordslaw import benfordslaw

# Initialize
bl = benfordslaw(pos=2)

# Load elections example
df = bl.import_example(data='elections_usa')

# Extract election information.
X = df['votes'].loc[df['candidate']=='Donald Trump'].values

# Make fit
results = bl.fit(X)

# Plot
bl.plot(title='Results of Donald Trump based on digit=2', barcolor=[0.5, 0.5, 0.5], fontsize=12, barwidth=0.4)
|
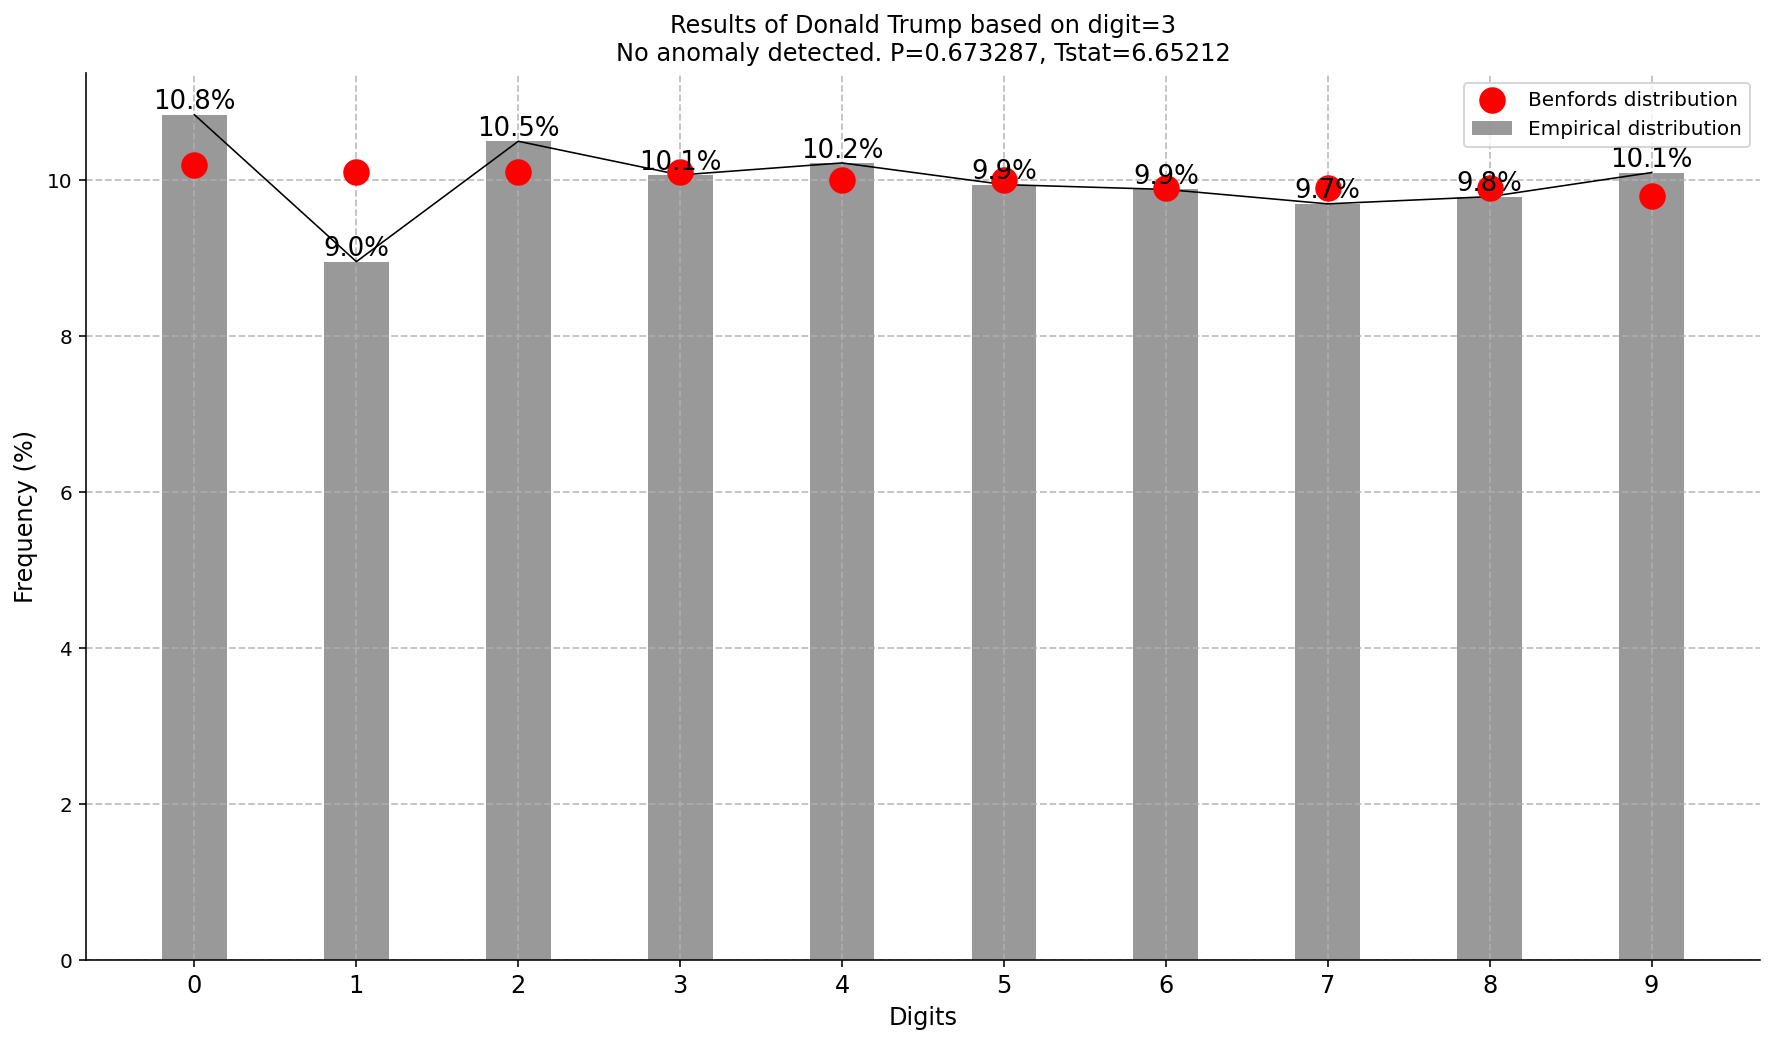
Third digit test
Let’s check the the votes on the second digit and determine whether it significantly deviates from benfords distribution.
from benfordslaw import benfordslaw

# Initialize
bl = benfordslaw(pos=3)

# Load elections example
df = bl.import_example(data='elections_usa')

# Extract election information.
X = df['votes'].loc[df['candidate']=='Donald Trump'].values

# Make fit
results = bl.fit(X)

# Plot
bl.plot(title='Results of Donald Trump based on digit=3', barcolor=[0.5, 0.5, 0.5], fontsize=12, barwidth=0.4)
|
All other digits [4-9] and last digits
Benford’s Law has known distributions for the the first three digits. All digits that come after (like pos=4), the distribution is not explicitly defined in classical Benford’s Law. The significance of Benford’s Law in data declines as you move to higher digit positions, since the influence of digit distributions decreases and approaches uniformity. However, we can assume a uniform distribution which is being done for every digit above 3.
from benfordslaw import benfordslaw

# Initialize
bl = benfordslaw(pos=4)

# Load elections example
df = bl.import_example(data='elections_usa')

# Extract election information.
X = df['votes'].loc[df['candidate']=='Donald Trump'].values

# Make fit
results = bl.fit(X)

# Plot
bl.plot(title='Results of Donald Trump based on digit=4', barcolor=[0.5, 0.5, 0.5], fontsize=12, barwidth=0.4)
|
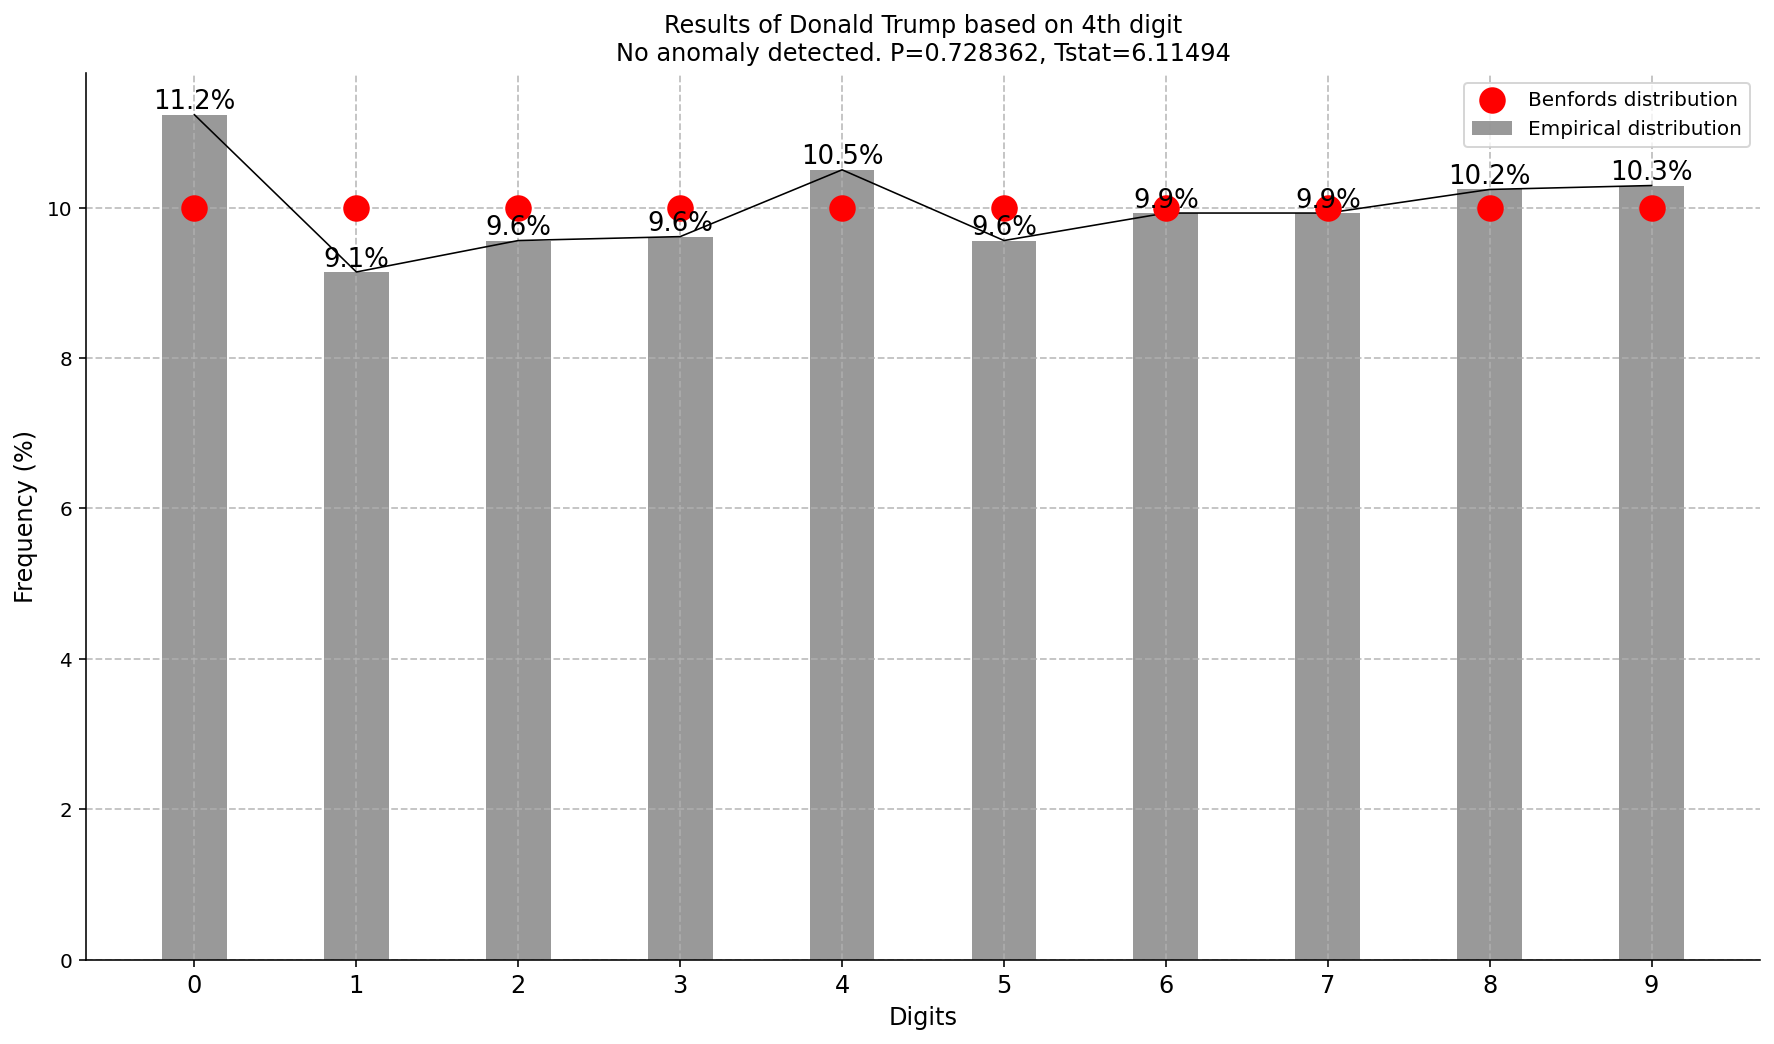
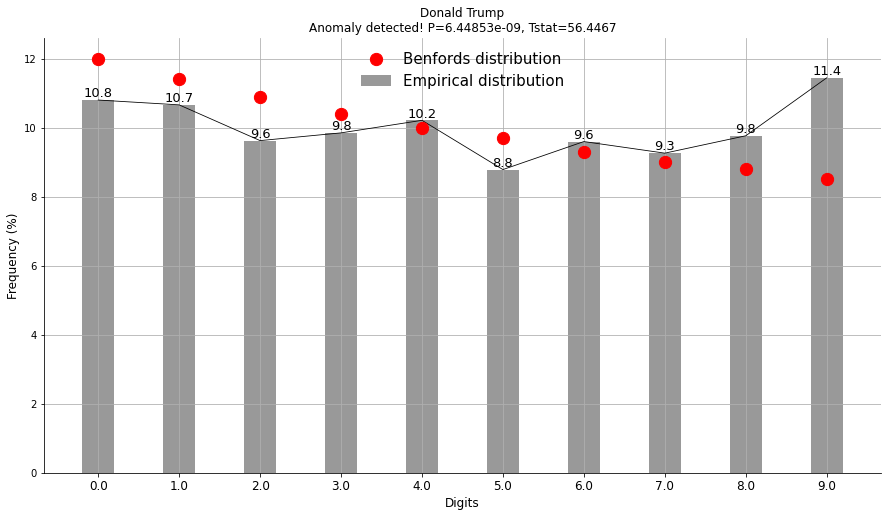
Last digit test
Let’s check the the votes on the last digit and determine whether it significantly deviates from benfords distribution. Benford’s Law has known distributions for the the first three digits. For other digits there is no distribution explicitly defined in classical Benford’s Law. However, we can assume a uniform distribution which is being done for every last digits.
from benfordslaw import benfordslaw

# Initialize
bl = benfordslaw(pos=-1)

# Load elections example
df = bl.import_example(data='elections_usa')

# Extract election information.
X = df['votes'].loc[df['candidate']=='Donald Trump'].values

# Make fit
results = bl.fit(X)

# Plot
bl.plot(title='Results of Donald Trump based on digit=-1', barcolor=[0.5, 0.5, 0.5], fontsize=12, barwidth=0.4)
|
Second last digit test
Let’s check the the votes on the second last digit and determine whether it significantly deviates from benfords distribution. Benford’s Law has known distributions for the the first three digits. For other digits there is no distribution explicitly defined in classical Benford’s Law. However, we can assume a uniform distribution which is being done for every last digits.
from benfordslaw import benfordslaw

# Initialize
bl = benfordslaw(pos=-2)

# Load elections example
df = bl.import_example(data='elections_usa')

# Extract election information.
X = df['votes'].loc[df['candidate']=='Donald Trump'].values

# Make fit
results = bl.fit(X)

# Plot
bl.plot(title='Results of Donald Trump based on digit=-2', barcolor=[0.5, 0.5, 0.5], fontsize=12, barwidth=0.4)
|